I've been doing a lot of static analysis on our projects at work lately. As
part of that task we added NCover to our automated build process. Our
build runs on Team Build (TFS) and is specified in an MSBuild file.
We wanted to take code metrics very seriously and we purchased the
complete version of the product to take full advantage of its
capabilities.
Getting NCover to run in your build is very simple and the online
documentation will be enough to figure it out. The problem comes
when you begin needing to create more and more variations of the
reports. The online documentation is a little short on this aspect,
especially on how to use the MSBuild or NAnt custom tasks. I hear
they plan to update the site with better docs for the next version
of the product.
NCover Complete comes with 23 different types of reports and
a ton of parameters that can be configured to produce far
more helpful reports than just sticking to the defaults.
For example, we are working on a new release of our product and
we are pushing ourselves to produce more testable code and
write more unit tests for all the new code. The problem is
that the new code is a just tiny fraction of the existing code and
the metrics get averaged down by the older code.
The key is to separate the code coverage profiling (which is
done by NCover while it runs all the unit tests with NUnit) from
the rendering of the reports. That way we only run the code coverage once; and that
can sometimes take a good chunk of time to produce the coverage data.
Rendering the reports is much quicker since the NCover reporting engine can feed off the
coverage data as many times as we need, very quickly.
Once we have the coverage data we can choose which report types we want
to create, the thresholds for sufficient coverage (or to fail the build), which assemblies/types/methods
we want to include/exclude from each report and where to save each of them.
Example
To demonstrate what I just described in practice, I decided to take
an existing open source project and add NCover reporting to it. The
project I selected was AutoMapper mostly because it's not very big
and has decent test coverage.
I downloaded the project's source code from the repository and
added a file named AutoMapper.msbuild to its root directory. You
can download
this entire file but I'll go over it piece by piece.
We start by just importing the MSBuild tasks that ship with NCover into our script and
declaring a few targets, including one to collect coverage data and one to generate the reports.
I added the NCover tasks dll to the project directory tools/NCoverComplete.
<Project DefaultTargets="RebuildReports"
  xmlns="http://schemas.microsoft.com/developer/msbuild/2003" >
  <UsingTask  TaskName="NCover.MSBuildTasks.NCover"
        AssemblyFile="$(ProjectDir)tools\NCoverComplete\NCover.MSBuildTasks.dll"/>
  <UsingTask  TaskName="NCover.MSBuildTasks.NCoverReporting"
        AssemblyFile="$(ProjectDir)tools\NCoverComplete\NCover.MSBuildTasks.dll"/>

  <PropertyGroup>
    <Configuration Condition=" '$(Configuration)' == '' ">Debug</Configuration>
    <BuildDir>$(MSBuildProjectDirectory)\build\$(Configuration)</BuildDir>
    <NUnitBinDirectoryPath>$(MSBuildProjectDirectory)\tools\NUnit</NUnitBinDirectoryPath>
  </PropertyGroup>

  <Target Name="RebuildReports" DependsOnTargets="RunCoverage;ExportReports" >
    <Message Text="We will rebuild the coverage data than refresh the reports."
          Importance="High" />
  </Target>

  <Target Name="RunCoverage" >
    <!-- snip -->
  </Target>

  <Target Name="ExportReports" >
    <!-- snip -->
  </Target>
</Project>
Now let's look closely at the target that gathers the coverage data. All it
does is tell NCover (NCover console, really) to run NUnit over the
AutoMapper.UnitTests.dll and save all the output to well-known locations.
<Target Name="RunCoverage" >
  <Message Text="Starting Code Coverage Analysis (NCover) ..." Importance="High" />
  <PropertyGroup>
    <NCoverOutDir>$(MSBuildProjectDirectory)\build\NCoverOut</NCoverOutDir>
    <NUnitResultsFile>build\NCoverOut\automapper-nunit-result.xml</NUnitResultsFile>
    <NUnitOutFile>build\NCoverOut\automapper-nunit-Out.txt</NUnitOutFile>
    <InputFile>$(BuildDir)\UnitTests\AutoMapper.UnitTests.dll</InputFile>
  </PropertyGroup>

  <NCover ToolPath="$(ProgramFiles)\NCover"
    ProjectName="$(Scenario)"
    WorkingDirectory="$(MSBuildProjectDirectory)"
    TestRunnerExe="$(NUnitBinDirectoryPath)\nunit-console.exe"

    TestRunnerArgs="$(InputFile) /xml=$(NUnitResultsFile) /out=$(NUnitOutFile)"

    AppendTrendTo="$(NCoverOutDir)\automapper-coverage.trend"
    CoverageFile="$(NCoverOutDir)\automapper-coverage.xml"
    LogFile="$(NCoverOutDir)\automapper-coverage.log"
    IncludeTypes="AutoMapper\..*"
    ExcludeTypes="AutoMapper\.UnitTests\..*;AutoMapper\.Tests\..*"
    SymbolSearchLocations="Registry, SymbolServer, BuildPath, ExecutingDir"
  />
</Target>
Of special interest in the NCover task above are the output files named
automapper)-coverage.xml and automapper-coverage.trend, which
contain the precious coverage data and historical trending respectively. In case
you're curious, the trend file is actually a SQLite3 database file that you
can report directly from or export to other database formats if you want.
Also note the IncludeTypes and ExcludeTypes parameters,
which guarantee that we are not tracking coverage on code that we don't care about.
Now that we have our coverage and trend data collected and saved to
files we know, we can run as many reports as we want without needing
to execute the whole set of tests again. That's in the next target.
<Target Name="ExportReports" >
  <Message Text="Starting Producing NCover Reports..." Importance="High" />
  <PropertyGroup>
    <Scenario>AutoMapper-Full</Scenario>
    <NCoverOutDir>$(MSBuildProjectDirectory)\build\NCoverOut</NCoverOutDir>
    <RptOutFolder>$(NCoverOutDir)\$(Scenario)Coverage</RptOutFolder>
    <Reports>
      <Report>
        <ReportType>FullCoverageReport</ReportType>
        <OutputPath>$(RptOutFolder)\Full\index.html</OutputPath>
        <Format>Html</Format>
      </Report>
      <Report>
        <ReportType>SymbolModuleNamespaceClass</ReportType>
        <OutputPath>$(RptOutFolder)\ClassCoverage\index.html</OutputPath>
        <Format>Html</Format>
      </Report>
      <Report>
        <ReportType>Trends</ReportType>
        <OutputPath>$(RptOutFolder)\Trends\index.html</OutputPath>
        <Format>Html</Format>
      </Report>
    </Reports>
    <SatisfactoryCoverage>
      <Threshold>
        <CoverageMetric>MethodCoverage</CoverageMetric>
        <Type>View</Type>
        <Value>80.0</Value>
      </Threshold>
      <Threshold>
        <CoverageMetric>SymbolCoverage</CoverageMetric>
        <Value>80.0</Value>
      </Threshold>
      <Threshold>
        <CoverageMetric>BranchCoverage</CoverageMetric>
        <Value>80.0</Value>
      </Threshold>
      <Threshold>
        <CoverageMetric>CyclomaticComplexity</CoverageMetric>
        <Value>8</Value>
      </Threshold>
    </SatisfactoryCoverage>

  </PropertyGroup>

  <NCoverReporting
    ToolPath="$(ProgramFiles)\NCover"
    CoverageDataPaths="$(NCoverOutDir)\automapper-coverage.xml"
    LoadTrendPath="$(NCoverOutDir)\automapper-coverage.trend"
    ProjectName="$(Scenario) Code"
    OutputReport="$(Reports)"
    SatisfactoryCoverage="$(SatisfactoryCoverage)"
  />
</Target>
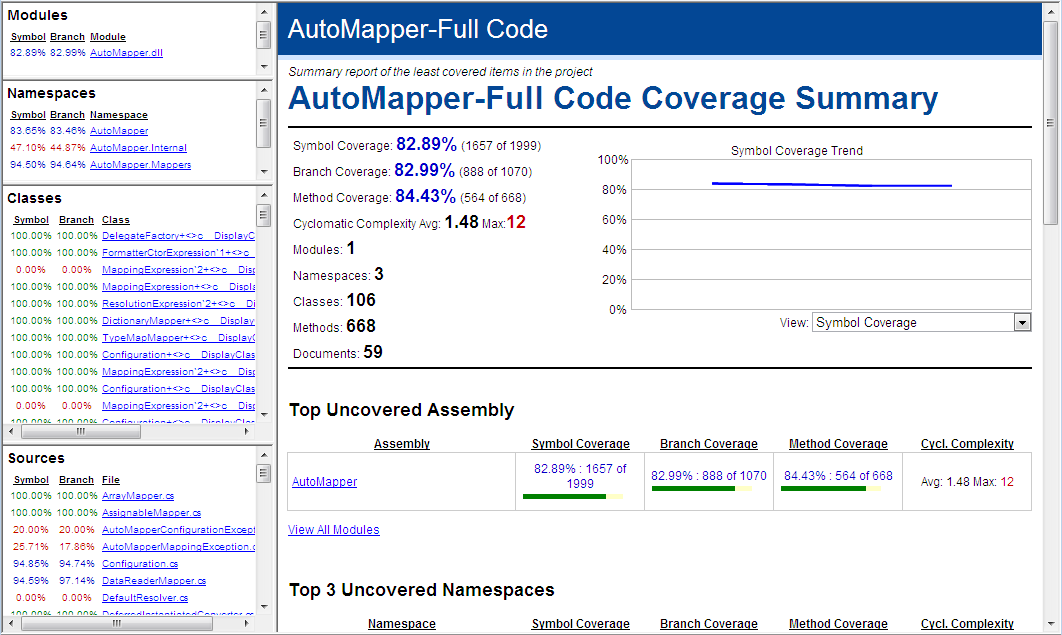
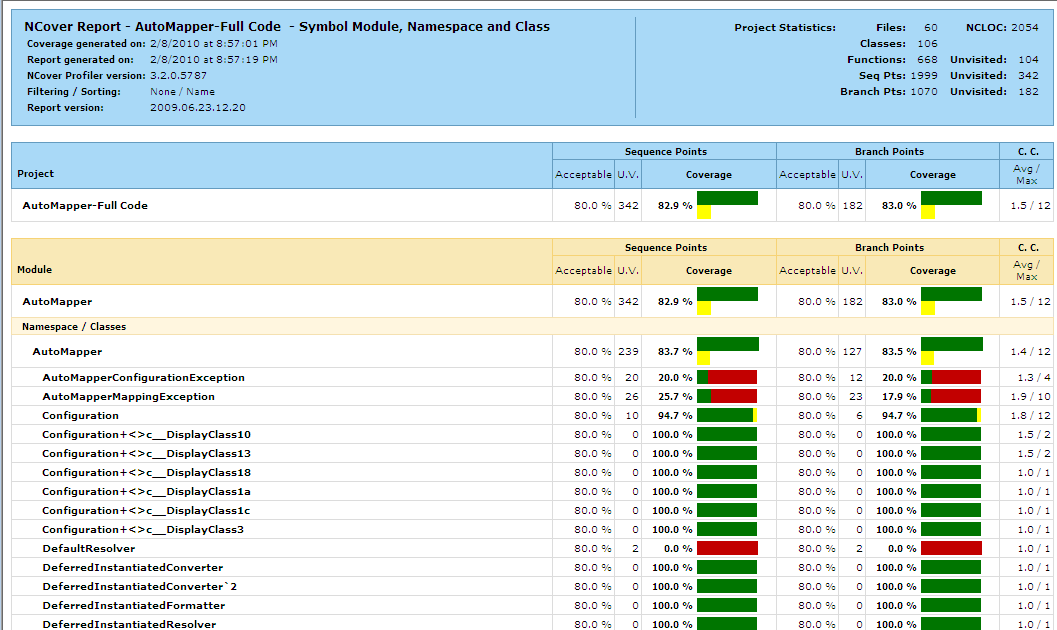
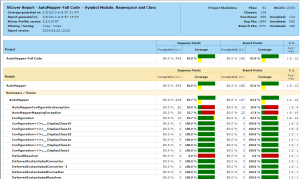
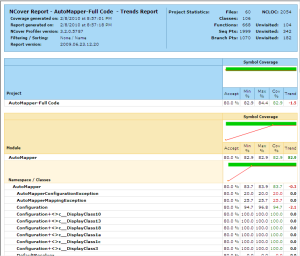
What you can see in this target is that we are creating three different
reports, represented by the Report elements and that
we are changing the satisfactory threshold to 80% code coverage
(down from the default of 95%) and the maximum cyclomatic complexity
to 8. These two blocks of configuration are passer to the NCoverReporting
task via the parameters OutputReport and SatisfactoryCoverage,
respectively.
The above reports are shown in the images below.
Focus on specific areas
Let's now say that, in addition to the reports for the entire source code, we
also want to keep a closer eye on the classes under the AutoMapper.Mappers
namespace. We can get that going with another reporting target, filtering the reported
data down to just the code we are interested in:
<Target Name="ExportReportsMappers" >
  <Message Text="Reports just for the Mappers" Importance="High" />
  <PropertyGroup>
    <Scenario>AutoMapper-OnlyMappers</Scenario>
    <NCoverOutDir>$(MSBuildProjectDirectory)\build\NCoverOut</NCoverOutDir>
    <RptOutFolder>$(NCoverOutDir)\$(Scenario)Coverage</RptOutFolder>
    <Reports>
      <Report>
        <ReportType>SymbolModuleNamespaceClass</ReportType>
        <OutputPath>$(RptOutFolder)\ClassCoverage\index.html</OutputPath>
        <Format>Html</Format>
      </Report>
      <!-- add more Report elements as desired -->
    </Reports>
    <CoverageFilters>
      <Filter>
        <Pattern>AutoMapper\.Mappers\..*</Pattern>
        <Type>Class</Type>
        <IsRegex>True</IsRegex>
        <IsInclude>True</IsInclude>
      </Filter>
      <!-- include/exclude more classes, assemblies, namespaces,
      methods, files as desired -->
    </CoverageFilters>

  </PropertyGroup>

  <NCoverReporting
    ToolPath="$(ProgramFiles)\NCover"
    CoverageDataPaths="$(NCoverOutDir)\automapper-coverage.xml"
    ClearCoverageFilters="true"
    CoverageFilters="$(CoverageFilters)"
    LoadTrendPath="$(NCoverOutDir)\automapper-coverage.trend"
    ProjectName="$(Scenario) Code"
    OutputReport="$(Reports)"
  />
</Target/>
Now that we have this basic template our plan is to identify
problem areas in the code and create reports aimed at them.
The URLs of the reports will be included in the CI build reports
and notification emails.
It's so easy to add more reports that we will have reports
that will live for a single release cycle or even less if
we need it.
I hope this was helpful for more people because it did take
a good amount of time to get it all sorted out. Even if
you're using NAnt instead of MSBuild, the syntax is
similar and I'm sure you can port the idea easily.